Research Projects
Stochastic simulation of storm surge extremes along the contiguous United States coastlines using the max-stable process [Read more]
Extreme sea levels impact coastal society, property, and the environment. Various mitigation measures are engineered to reduce these impacts, which require extreme event probabilities typically estimated site-by-site. The site-by-site estimates usually have high uncertainty, are conditionally independent, and do not provide estimates for ungauged locations. In contrast, the max-stable process explicitly incorporates the spatial dependence structure and produces more realistic event probabilities and spatial surfaces. We leverage the max-stable process to compute extreme event probabilities at gridded locations (gauged and ungauged) and derive their spatial surfaces along the contiguous United States coastlines by pooling annual maximum (AM) surges from selected long-record tide gauges. We also generate synthetic AM surges at the grid locations using the predicted distribution parameters and reordering them in the rank space to integrate the spatiotemporal variability. The results will support coastal planners, engineers, and stakeholders to make the most precise and confident decisions for coastal flood risk reduction.
|
|
Likelihood of fluvial flood related property damage in the U.S. under climate change
Flooding is one of the most devastating natural disasters causing significant economic losses. One of the dominant drivers of flood losses is heavy precipitation, with other contributing factors such as built environments and socio-economic conditions superimposed to it. To better understand the risk profile associated with this hazard, we develop probabilistic models to quantify the future likelihood of fluvial flood-related property damage exceeding a critical threshold (i.e., high property damage) at the state level across the conterminous United States. The model is conditioned on indicators representing heavy precipitation amount and frequency derived from observed and downscaled precipitation. The likelihood of high property damage is estimated from the conditional probability distribution of annual total property damage, which is derived from the joint probability of the property damage and heavy precipitation indicators. Our results indicate an increase in the probability of high property damage (i.e., exceedance of 70th percentile of observed annual property damage for each state) in the future. Higher probability of high property damage is projected to be clustered in the states across the western and south-western United States, and parts of the U.S. Northwest and the northern Rockies and Plains. Depending on the state, the mean annual probability of high property damage in these regions could range from 38% to 80% and from 46% to 95% at the end of the century (2090s) under RCP4.5 and RCP8.5 scenarios, respectively. This is equivalent to 20%–40% increase in the probability compared to the historical period 1996–2005. Results show that uncertainty in the projected probability of high property damage ranges from 14% to 35% across the states. The spatio-temporal variability of the uncertainty across the states and three future decades (i.e., 2050s, 2070s, and 2090s) exhibits nonstationarity, which is driven by the uncertainty associated with the probabilistic prediction models and climate change scenarios.
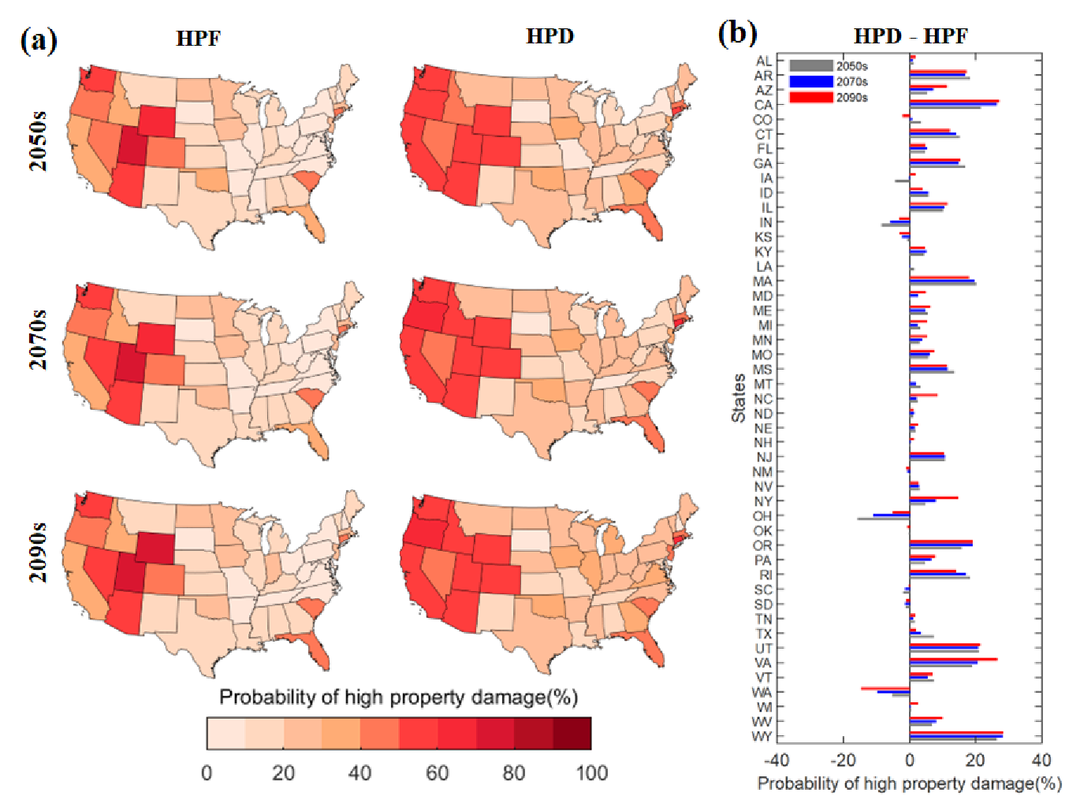
Figure: Mean (averaged over all selected climate models) annual probability of high property damage conditioned on HPF and HPD for different future periods (top to bottom on the left: 2050s, 2070s, 2090s) under RCP8.5 scenario. (b) Differences in annual probability of high property damage conditioned on HPD and HPF for different future periods.
|
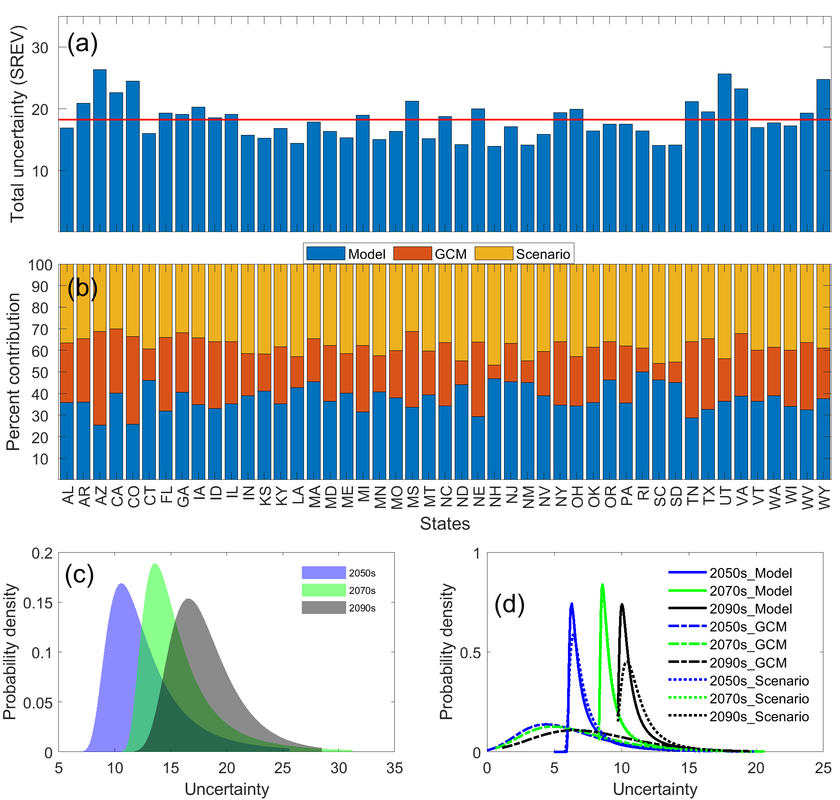
Figure: Total uncertainty (in %) and (b) relative contribution of prediction models, GCMs, and scenarios to the total uncertainty for different states across the CONUS for 2090s. Red horizontal line in (a) illustrates the median value of the total uncertainty across all states. Probability density functions of uncertainty of all CONUS states for different future decades (i.e., 2050s, 2070s and 2090s) for (c) total uncertainty and (d) uncertainty from prediction models, GCMs, and scenarios.
|
Increased hydrologic risk from consecutive dry and wet events
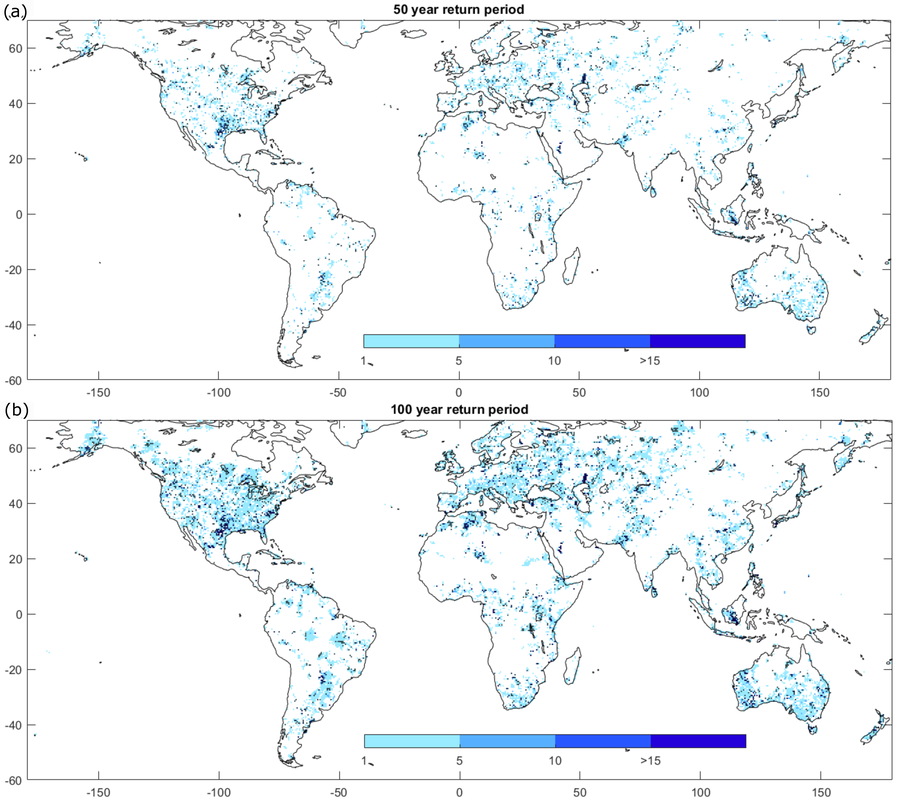
Dry and wet extremes (i.e., droughts and floods) are the costliest hydrologic hazards for infrastructure and socio-environmental systems. Being closely interconnected and interdependent extremes of the same hydrological cycle, they often occur in close succession with the potential to exacerbate hydrologic risks. However, traditionally this is ignored and both hazards are considered separately in hydrologic risk assessments; this can lead to an underestimation of critical infrastructure risks (e.g., dams, levees, dikes, and reservoirs). Here, we identify and characterize consecutive dry and wet extreme (CDW) events using the Standardized Precipitation Evapotranspiration Index, assess their multi-hazard hydrologic risks employing copula models, and investigate teleconnections with large-scale climate variability. We identify hotspots of CDW events in North America, Europe, and Australia where the total numbers of CDW events range from 20 to 30 from 1901 to 2015. Decreasing trends in recovery time (i.e., time between termination of dry extreme and onset of wet extreme) and increasing trends in dry and wet extreme severities reveal the intensification of CDW events over time. We quantify that the joint exceedance probabilities of dry and wet extreme severities equivalent to 50-year and 100-year univariate return periods increase by several folds (up to 20 and 54 for 50-year and 100-year return periods, respectively) when CDW events and their associated dependence are considered compared to their independent and isolated counterparts. We find teleconnections between CDW and Niño3.4; at least 80% of the CDW events are causally linked to Niño3.4 at 50% of the grid locations across the hotspot regions. This study advances the understanding of multi-hazard hydrologic risks from CDW events and the presented results can aid more robust planning and decision-making.
|
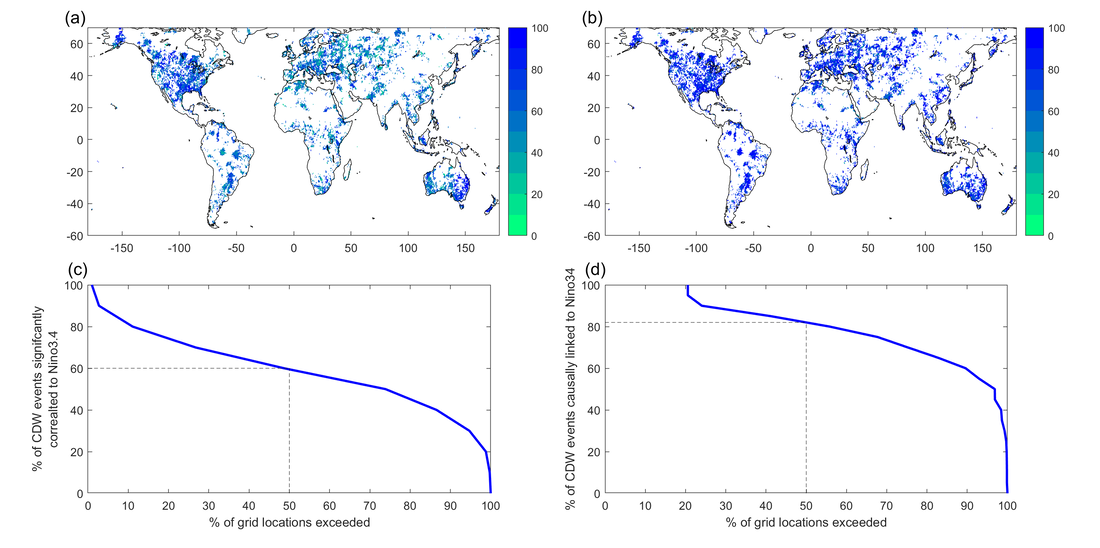
Figure: Teleconnections of CDW events to sea surface temperature (i.e., Niño3.4). Percentage of CDW events significantly (at 90% significance level) correlated to the Niño3.4 (a) and causally linked to Niño3.4 (b) at grid locations with > 20 CDW events. Empirical probability distribution functions of percent of CDW events significantly correlated to Niño3.4 (c) and causally linked to Niño3.4 (d)
|
Figure: Multi-hazards Hydrologic Risk Ratio (MHRR) at grid locations with >=20 CDW events for dry and wet extreme severities equivalent to univariate 50-year(a) and 100-year(b)return periods. The stipples represent the grid locations where the joint exceedance probabilities are significantly (at 10% significance level as per t-test) higher when CDW and dependence are considered compared to the assumption of independent univariate dry and wet extremes.
Risk of extreme sea level and compound flood
Supported by a research grant from NOAA, this project has introduced an aggregated extreme sea level indicator for the contiguous U.S. coast comprised of separate indicators for mean sea level (MSL) and storm surge climatology (SSC). Non-Stationary extreme value analysis is performed to derive multi-decadal variability of SSC and employed K-means clustering to identify regions of coherent variability. This research highlights the important role of interannual to multi-decadal variability in different sea level components in exacerbating, or reducing, the impacts of long-term MSL rise over time scales relevant for planning and management of coastal cities. Different models are developed to predict the SSC indicator using climate indices, sea level pressure, and sea surface temperature as predictor variables. Predictability of the indicator using initialized decadal climate model experiments are also been assessed. Additionally, I have also been working to assess coastal flood risk from concurrent or successive events of multiple drivers such as storm surge, high tide, extreme rainfall, and river discharge using copulas. I look forward to understad how these flood events are modulated by the large scale climate variability using weather typing.


Rainfall-streamfow model integrating wavelet and GAMLSS
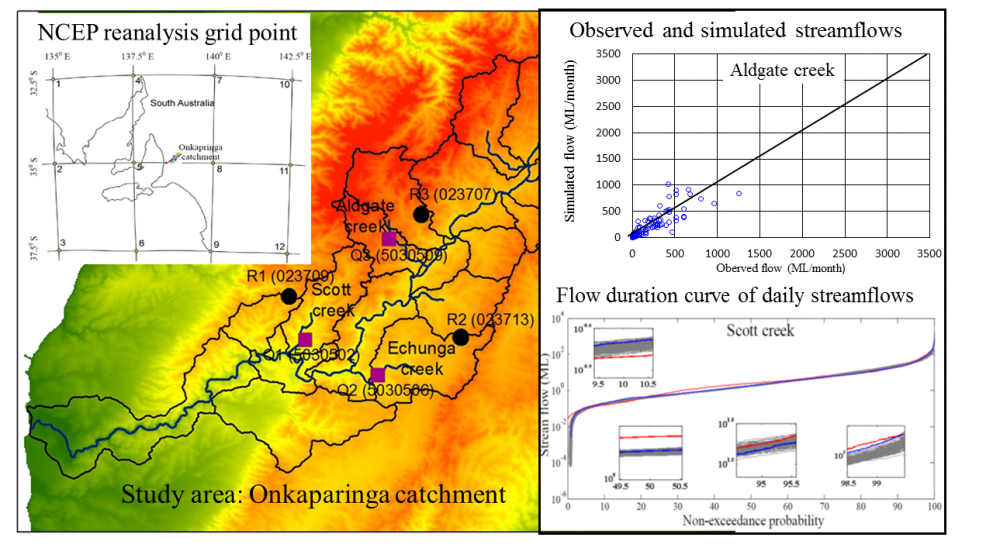
A rainfall–streamflow model is proposed, in which a downscaled rainfall series and it's wavelet-based decomposed sub-series at optimum lags were used as covariates in GAMLSS (Generalized Additive Model in Location, Scale and Shape). GAMLSS is applied in climate change impact assessment using CMIP5 general climate model to simulate daily streamflow in three sub-catchments of the Onkaparinga catchment, South Australia. Study shows that the GAMLSS has the capability to capture non-stationarity in the rainfall–streamflow process. It was also observed that the use of wavelet-based decomposed rainfall sub-series with optimum lags as covariates in the GAMLSS model captures the underlying physics of the rainfall–streamflow process. The development and application of an empirical rainfall–streamflow model that can be used to assess the impact of catchment-scale climate change on streamflow is demonstrated.
Modelling sustained drought and wet anomalies
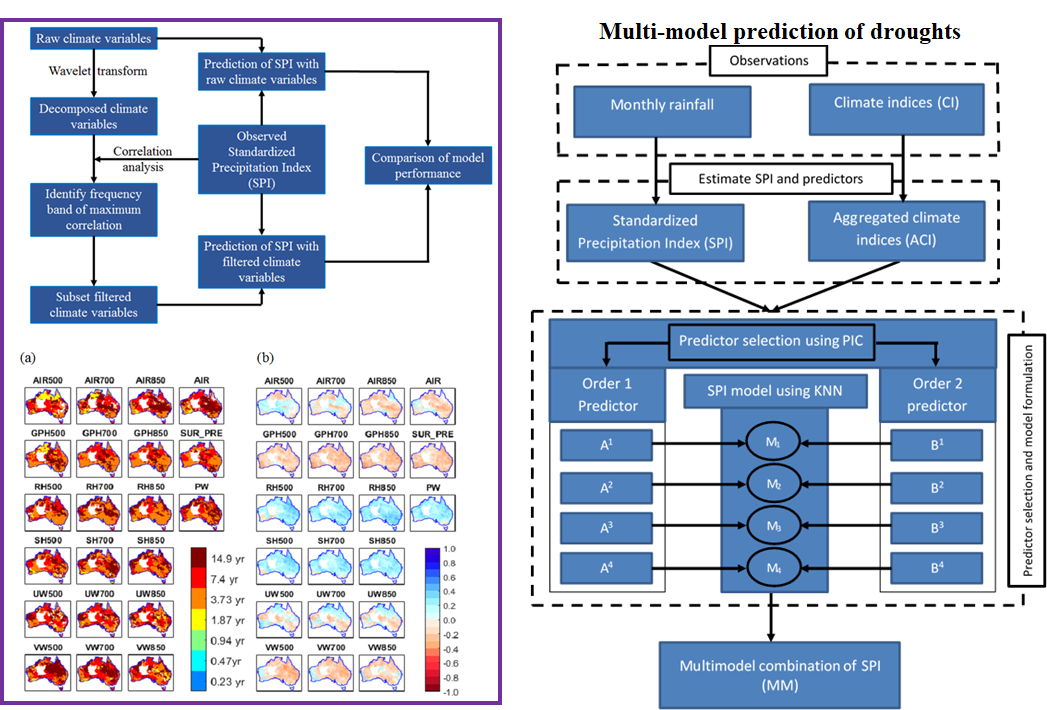
This research investigates the relationships of drought and reanalysis climate variables filtered to specific frequency bands using wavelet transforms. The key innovation of this study is to filter the predictor variables using wavelets to enhance the information content at the relevant frequencies for droughts that has potential application in monitoring and projection of future droughts from GCMs datasets. Additionally, the merit of distorting the time aggregation of large scale climate indices (Nino3.4 and DMI) have investigated before casting them in a drought predictive model. Aggregated climate indices are used to predict sustained drought and wet anomalies characterized here using a drought index (i.e. Standardize Precipitation Index, SPI) as a response and Australia as the study region of interest. The aim is to enhance the strength of relationships of drought index and climate indices (predictors) by tuning the frequency of climate predictors using an aggregation technique. The result shows that aggregated climate indices provide significant improvement in the prediction of SPI over raw climate indices across Australia.
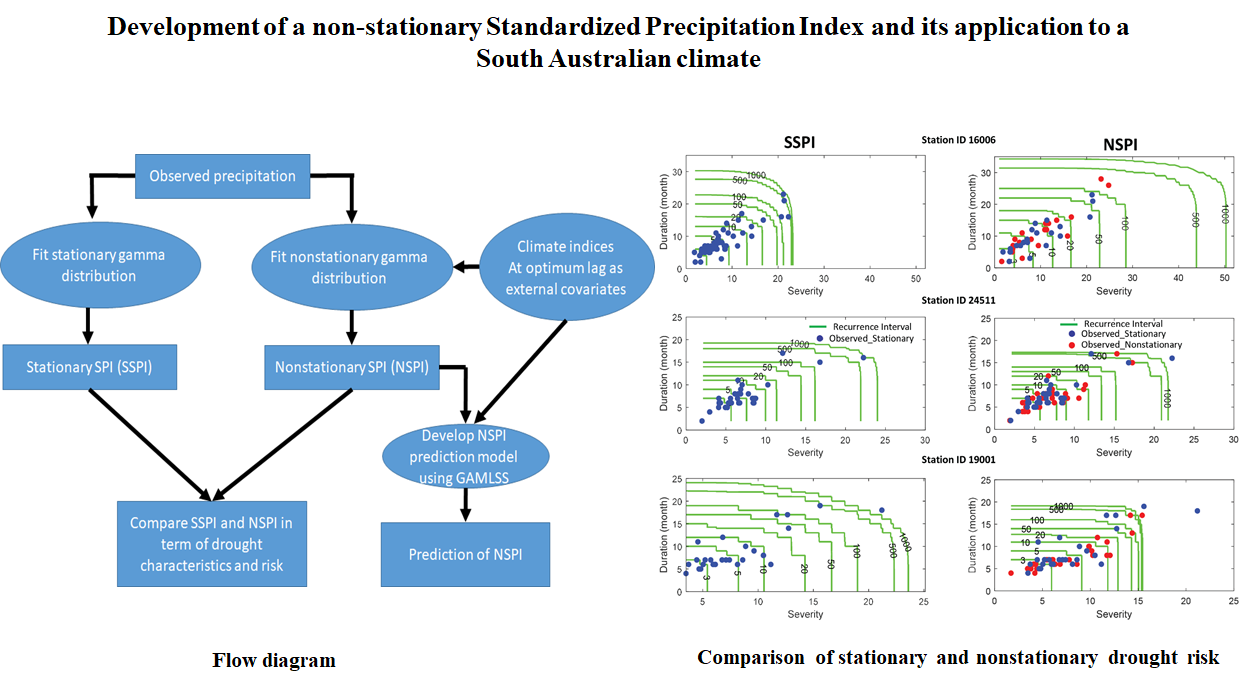
Monitoring droughts with non-stationary drought index
Droughts are often monitored based on the changes of aggregated hydro-climatic variables e.g. rainfall, soil moisture, and streamflow. Although hydro-climatic time series are often nonstationary, traditional standardized drought monitoring indices, for example, Standardized Precipitation Index (SPI) do not take nonstationary into account make these indices unreliable for monitoring droughts in changing climates. Therefore, I developed a nonstationary SPI (NSPI) within the Generalized Additive Model in Location, Scale and Shape (GAMLSS) modeling framework and demonstrated that the NSPI outperform to identify droughts in a changing climate.
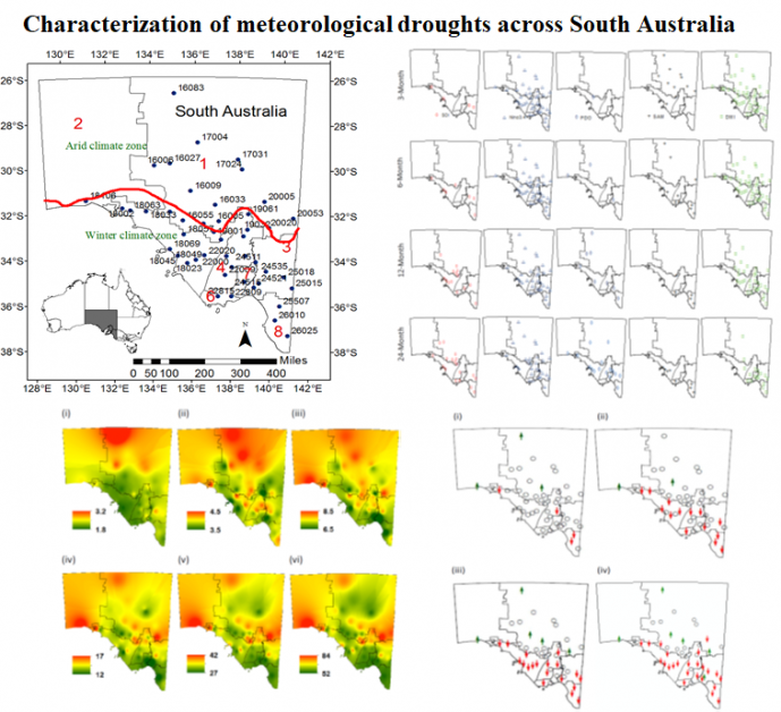
Characterization of droughts in multivariate perspective
This study considers the Standardized Precipitation Index (SPI) at time scales of 3, 6, 12 and 24 months to assess both short‐term and long‐term droughts in South Australia (SA). Trends in the SPI at 46 selected rainfall stations across South Australia (SA) are investigated. Furthermore, various drought parameters such as frequency, severity, and duration are estimated, and their spatial distributions are presented. Drought risks are estimated in terms of copula based bivariate joint return periods and compared with traditional univariate return periods. Finally, the dominant climatic modes of sustained drought and wet anomalies are identified using correlation analysis. The results highlight the suitability of a bivariate joint return period over a univariate return period for drought risk assessment because the drought is a multi‐faceted phenomenon. The dominant climatic modes identified in this study are Niño3.4 and the dipole mode index (DMI), which are able to represent the SPI across SA at the selected time scales.
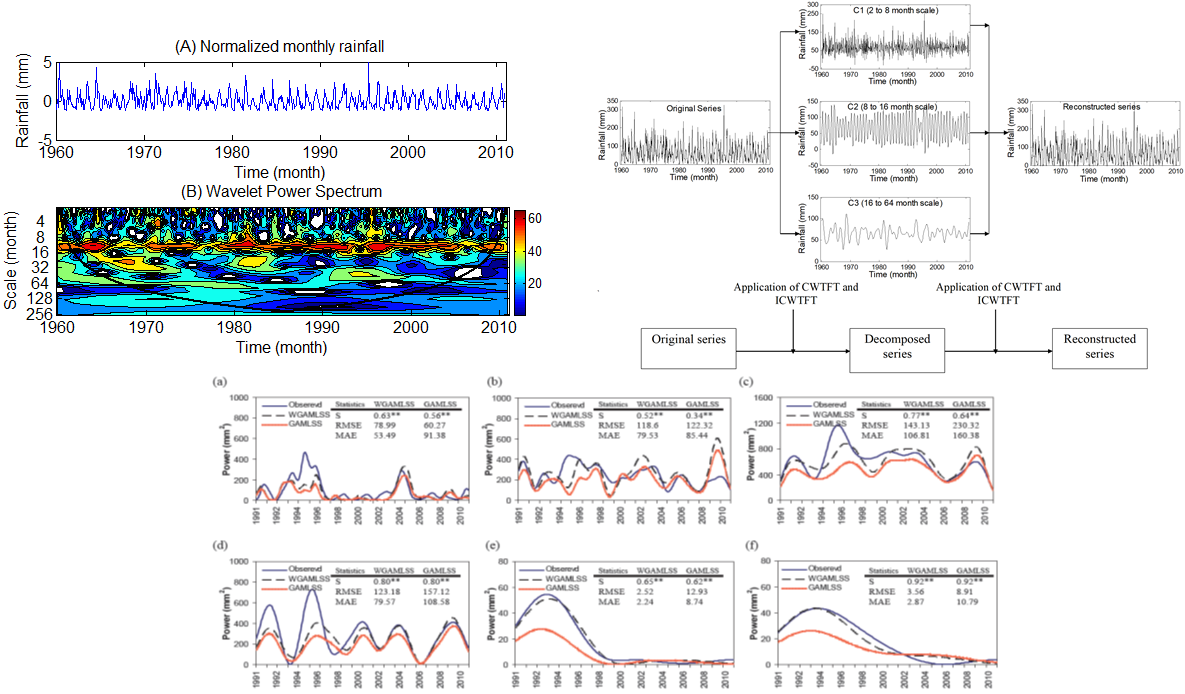
Statistical downscaling: A non-stationary and multi-resolution approach
Hydroclimatic variable such as rainfall is non-stationary and low frequency variability (i.e. persistence) is vital to reproduce hydrological extreme events such as flood and drought. This suggests that a non-stationary model capable to reproduce low frequency variability of rainfall is essential. Therefore, I developed a noble downscaling approach where predictand (i.e. rainfall) and predictors (i.e. climate variables from reanalysis and /or GCM outputs) are first decomposed by wavelet transforms (WT) and rainfall is modeled using the semi-parametric additive model formulation of GAMLSS. When compared with the traditional downscaling approach (i.e. application of GAMLSS to the original rainfall series without wavelet decomposition), the proposed model outperforms at reproducing the time-frequency properties of the observed rainfall and still preserve the statistics produced by traditional modelling approach.
Frequency level trend detection technique using wavelet decompostion
This study focuses on identifying existing trends in annual, seasonal and monthly rainfall at thirteen stations in the Onkaparinga catchment in South Australia during the period 1960-2010. A new trend detection approach was developed, which combines a Continuous Wavelet Transform (CWT) with the Mann Kendall (MK) test. The original rainfall time series was decomposed to different periodic components using a CWT and then the MK test was applied to detect the trends. The study showed that the periodic components (generally low-frequency signals) might have significant trends even when there are no significant trends in the original data. Thus signifies the potential of this trend detection approach to detect climate change compare to the conventional approach of considering the original series of hydroclimatic variables. A sequential Mann-Kendall analysis was found useful for identifying the trend turning points. Most of the trends, whether positive or negative, started during the mid-1970s to mid-1980s. The technique developed in this study may also be applied for trend detection of other hydro-climatic variables in other catchments, particularly where temporal and spatial variabilities are high.

Statistical downscaling of GCM outputs to rainfall
This project investigates the future changes in hydrologically relevant rainfall metrics compare to the historical period. I developed a multi-site statistical downscaling model using Generalized Linear Model (GLM). Logistic regression was used to identify the wet days and an amount model was fitted using a gamma distribution to estimate the amount of rain on wet days. I downscaled rainfall for future periods from CMIP5 General Circulation Models (GCMs). I developed an innovative Frequency Adapted Quantile Mapping (FAQM) technique for bias correction of the downscaled rainfall. Additionally, I developed a nonstationary model to estimate the return periods of annual maximum daily rainfall (AMDR). I conducted this project as a part of the largest ever climate change research project in South Australia and was funded by Goyder Institute for Water Research.

