Software/Script: Stochastic Simulation of Storm Surge Extremes (SExtemes)
|
Codes/scripts for modeling storm surge extremes (Annual Maxima, AM) using the max-stable process to estimate return levels and stochastically simulate synthetic AM surge at gauged and ungauged (non-uniform grided) locations along the contiguous United States (CONUS) coastlines. All source codes/scripts are written in MATLAB/ R language.
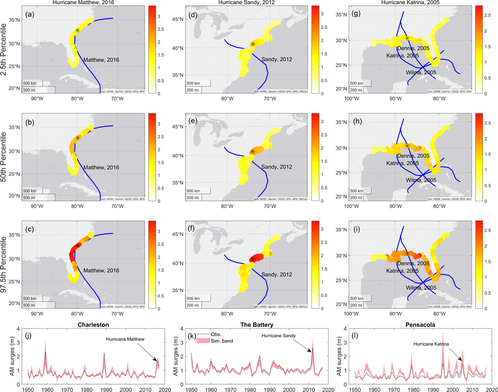
This software includes scripts for spatial-temporal modeling of storm surge extremes (annual maxima) using the max-stable process, which estimates the Generalized Extreme Values distribution parameters and quantifies storm surge magnitudes at different return periods (i.e., 10-year, 50-year, and 100-year) at gauged and ungauged locations by fitting the models to the selected 41 tide gauges of long-rector sea level information along the U.S. coastlines. The software also included the methods/ scripts for stochastic simulation of AM surges at gauged and ungauged grid locations along the CONUS coastlines. The software includes different functions/scripts written in Matlab/R language. Please follow the instructions in the "ReadMe.txt" file for further details and to run the software. Please cite the paper Rashid, M.M., Moftakhari, H. & Moradkhani, H. Stochastic simulation of storm surge extremes along the contiguous United States coastlines using the max-stable process. Commun Earth Environ 5, 39 (2024). https://doi.org/10.1038/s43247-024-01206-z |
|
Package Repository: |

|
Database: Stochastic Simulation of Storm Surge Extremes along the United States Coastlines
This database includes data developed from the spatial-temporal modeling of storm surge extremes (annual maxima) using the max-stable process, which is as follows.
(1) Parameters of the modeled/ fitted Generalized Extreme Values distribution at grided (gauged and ungauged) locations along the contiguous United States (CONUS) coastlines.
(2) Storm surge magnitudes at different return periods (i.e., 10-year, 50-year, and 100-year) at the grided location along the CONUS coastlines.
(3) Stochastic simulation of synthetic time series of AM surges at the grided locations along the CONUS coastlines.
Please cite the paper
Rashid, M.M., Moftakhari, H. & Moradkhani, H. Stochastic simulation of storm surge extremes along the contiguous United States coastlines using the max-stable process. Commun Earth Environ 5, 39 (2024). https://doi.org/10.1038/s43247-024-01206-z
Data Repository: |

|
R Package: WAvelet System Prediction (WASP)
|
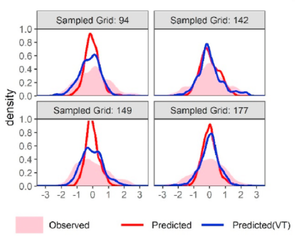
WAvelet System Prediction (WASP) is a R package includes discrete wavelet transformation (DWT) based variance transformation method. This method refines the spectral representation of the predictor variables for improved prediction of system response. This package also includes the maximum overlap DWT (MODWT) (a variant of DWT) - based variance transformation which allows to use the method for forecasting application. The predictive model used in the framework is a K-nearest neighbor (KNN) approach. The main functions that the software can performs are: (1) transforming the system predictors, (2) identifying significant predictors corresponding to response, and (3) predicting target response using the KNN. An application to predicting sustained drought anomalies across Australia showed a clear improvement compared to the untransformed raw predictors.
Reference: Jiang, Z., Rashid, M. M., Johnson, F., & Sharma, A. (2020). A wavelet-based tool to modulate variance in predictors: An application to predicting drought anomalies. Environmental Modelling & Software, 104907. doi:https://doi.org/10.1016/j.envsoft.2020.104907
|
|
Package Repository: |

|
MATLAB Package: Non-stationary Storm Surge Indicator (NSSI)
|
This package includes source codes/scripts for developing and analyzing of storm surge climatology (SSC) indicator were developed in MATLAB 2017b. This estimates storm surge climatology (SSC) indicator from tide gauge hourly sea level data. SSC indicator is the return sea level (e.g. 100 year) estimated by fitting a quasi non-stationary extreme value model to seasonal (i.e. two halves of the year: summer and winter) maximum sea levels. Software includes different functions/scripts written in MATLAB language. This also include a "ReadMe.txt" file for further details and to run the the software.
References:
Rashid, M.M., Wahl, T., Chambers, D.P., Calafat, F.M., Sweet, W.V. (2019). An extreme sea level indicator for the contiguous United States coastline, Nature Scientific Data, 6, 326, doi:10.1038/s41597-019-0333-x. Rashid, M. M., Wahl, T., Chamber, D. P., Calafat, F. M. & Sweet, W. V. Source code for extreme sea level indicators for the contiguous United States coastline. figshare, https://doi.org/10.6084/m9.figshare.8258912 |
Package Repository: |

|
Database: Extreme Sea Level (ESL) indicators for the contiguous US coastline
|
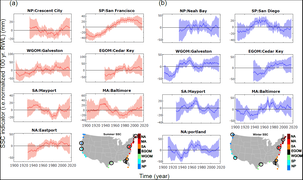
An Extreme Sea Level (ESL) indicator was developed for the contiguous United States coastline comprised of separate indicators for mean sea level (MSL) and storm surge climatology (SSC). ESL was derived by superimposing MSL, SSC, and long period tides, hence represent the combination of (i) the interannual variability of MSL after removing the influence of long-term global sea-level rise and vertical land motion, (ii) the multidecadal variations in SSC expressed as changes in the 100-year return sea levels estimated by nonstationary extreme value modeling after removing the MSL and long period tidal signals, and (iii) the fluctuations of the 4.4-year perigean and 18.6-year nodal tidal cycles. Database includes time series of MSL and SSC indicators. SSC indicators for different regions as well as series of combined 4.4 and 18.6-year tidal cycles are provided for summer and winter half year separately. Estimation of location, scale, and shape parameters of generalized extreme value distribution are provided. Two animation files those represent the changes of ESL over time are also included in the database.
Reference: Rashid, M.M., Wahl, T., Chambers, D.P., Calafat, F.M., Sweet, W.V. (2019). An extreme sea level indicator for the contiguous United States coastline, Nature Scientific Data, 6, 326, doi:10.1038/s41597-019-0333-x.
|
|
Data Repository: |

|
Group Plot: MATLAB Script for plotting two data matrices in a single colorplot
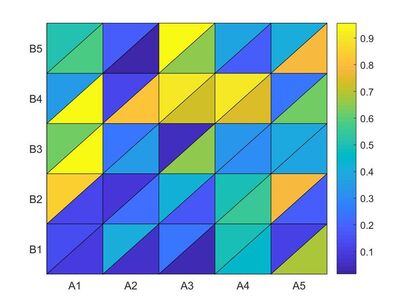
This is a MATLAB script useful to present two data matrices in a single plot with gradual color. This script generates a figure that display two data matrices simultaneously (please see the figure). Each square is diagonally divided into two triangles and each triangle represents a single data point from each corresponding data matrix (out of 2 data matrices).
Code Repository: |

|
